
How Federal Debt Affects Household Borrowing Costs
Federal debt held by the public is around 100% of GDP this year and, in CBO’s projections, rises to 107% by 2029, which would top the postwar record set in 1946 CBO says. That matters far beyond Washington’s ledgers. The same drift in debt has already been pushing up what households pay to borrow.
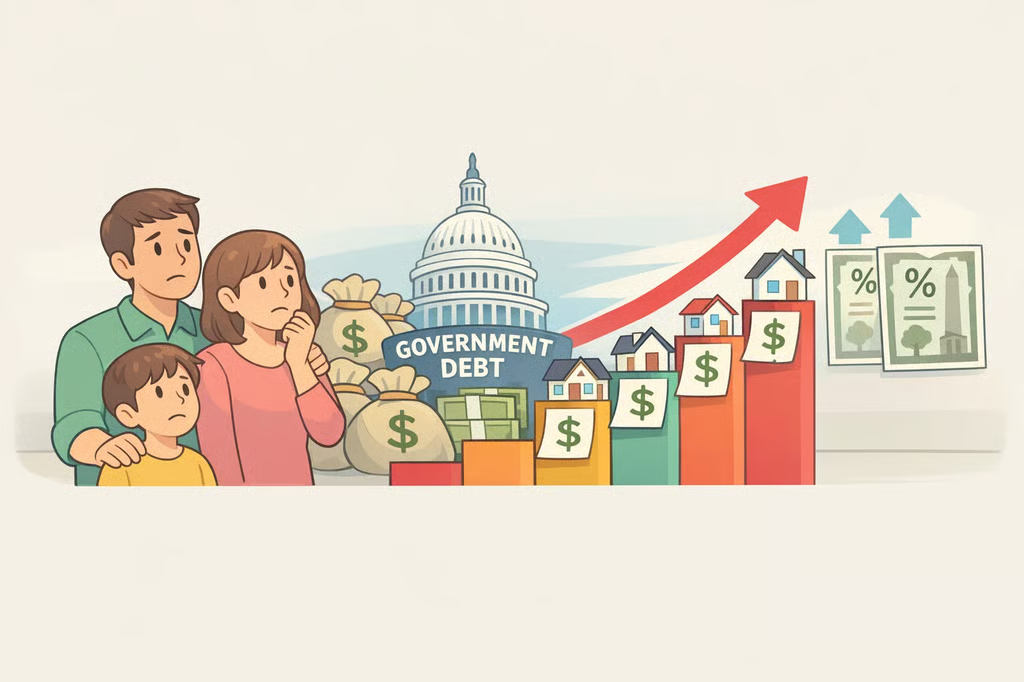
A March 2026 analysis from the Yale Budget Lab estimates that fiscal policy decisions made since 2015 have lifted 10-year-ahead projected federal debt by about 49 percentage points of GDP, which in turn has raised long-term Treasury yields by about 97 basis points. Treasury yields sit near the base of the lending stack, so when they move, mortgages, auto loans and small-business credit tend to move with them.
Federal debt at its highest level since 1946
CBO’s January 2025 budget outlook put federal debt held by the public at 100% of GDP in 2025 and projected it to reach 118% by 2035 CBO reported. The agency also said the federal deficit would be $1.9 trillion in fiscal 2025 and widen to $2.7 trillion by 2035. By then, the adjusted deficit would equal 6.1% of GDP, well above the 3.8% average over the last 50 years CBO reported.
The longer horizon is worse. CBO’s March 2025 long-term outlook says debt held by the public increases in every year from 2025 through 2055, reaching 156% of GDP and still trending upward CBO says. In that same projection, 2029 is the year debt crosses the old 1946 peak of 106% of GDP CBO says.
That is the milestone worth watching. The country is not there yet in the literal, nailed-down sense. It is on track to get there, and the path is already visible.
How federal debt affects household borrowing costs
The Budget Lab’s estimate is model-based, not a line item pulled from a bank statement. It uses a standard relationship between debt and Treasury yields, and the authors say the resulting rate effects are likely somewhat conservative Yale Budget Lab reports.
Still, the dollar impacts are concrete enough. For a family taking out a 30-year mortgage at the 2025Q3 median home price, that higher rate path translates into about $2,500 more a year in borrowing costs, or roughly $76,000 over the life of the loan Yale Budget Lab estimates. The annual mortgage-cost range in the study runs from about $1,900 to $3,750 Yale Budget Lab says.
The same logic reaches other kinds of credit. Annual borrowing costs on a typical auto loan are about $120 higher, and on a typical small-business loan about $770 higher, than they would be absent these fiscal-policy changes Yale Budget Lab found.
The policy choices behind the rise
The biggest jump in projected debt came from pandemic relief. The September 2020 CBO update, which captured the CARES Act and other pandemic relief enacted through mid-2020, added about 9 percentage points of projected debt-to-GDP Yale Budget Lab reported. The American Rescue Plan Act in March 2021 and the December 2020 Consolidated Appropriations Act together added another roughly 11 percentage points, making the COVID-era response the largest cumulative legislative contribution in the series Yale Budget Lab found.
Tax cuts mattered too. The April 2018 CBO update, which reflected the Tax Cuts and Jobs Act and the Bipartisan Budget Act of 2018, added about 9 percentage points of projected debt-to-GDP and raised long-term Treasury yields by roughly 19 basis points Yale Budget Lab said. The TCJA alone was scored by CBO and JCT at about $1.5 trillion in 10-year deficit costs Yale Budget Lab reported.
Congress did push back once. The Fiscal Responsibility Act of 2023, which came out of the June 2023 debt-ceiling agreement, reduced projected debt-to-GDP by about 7 percentage points, the largest legislative reduction in the series Yale Budget Lab found. It helped, but only at the edges.
The latest Budget Lab data point, based on the February 2026 CBO projection, shows a modest net increase in projected debt-to-GDP Yale Budget Lab says. That reflects two large policy changes moving in opposite directions. CBO’s legislative changes category shows about $3.4 trillion more in projected 10-year deficits from the 2025 reconciliation act, including about $0.7 trillion in debt-service costs, partly offset by roughly $3 trillion in projected customs-duty revenue from tariff actions through November 20, 2025 Yale Budget Lab reported.
Why the interest cost problem compounds
Rising debt does not sit still. It drags interest costs higher, and those higher interest costs add to future debt. That loop is already visible in CBO’s numbers.
Starting in 2027, net interest outlays are projected to be larger relative to GDP than at any point since at least 1940 CBO noted. By 2035, they reach 4.1% of GDP and account for about one-sixth of federal spending CBO says.
The squeeze gets tighter after that. By 2055, net interest outlays rise to 5.4% of GDP, driven by sustained primary deficits and a rising average interest rate on federal debt CBO projects. CBO says mounting debt would slow economic growth, push more interest payments to foreign holders of U.S. debt and leave lawmakers with less room to maneuver in the next crisis CBO warns.
That is the part households feel even if they never read a budget table. Higher Treasury rates do not map one-for-one into every mortgage quote or auto-financing offer, because Fed policy, inflation expectations and credit risk all matter too. But debt pressure is one of the structural forces leaning on borrowing costs, and it does not go away just because the news cycle gets bored.
For borrowers, the useful takeaway is not that a single federal bill sets next month’s mortgage rate. It is that the debt path now running through Washington is feeding a slower, steadier upward pull on the cost of money. That is a dull mechanism, which is probably why it keeps winning.