What Net Worth Needed to Be in the Top 10% Looks Like
The phrase “net worth needed to be in the top 10%” sounds tidy enough. A million dollars, maybe a little more, and you’re in the club. The data is less flattering to that idea. In 2023, the 90th percentile of household wealth was $1,806,000, according to U.S. Census Bureau data published in July 2025.
That puts the top-10% bar at nearly ten times the median household wealth of $191,100 in the same year (U.S. Census Bureau, July 2025). It also means a seven-figure net worth is not enough. It is a respectable number, but not the number people usually imagine when they say “wealthy.”
How the top 10% net worth threshold is measured
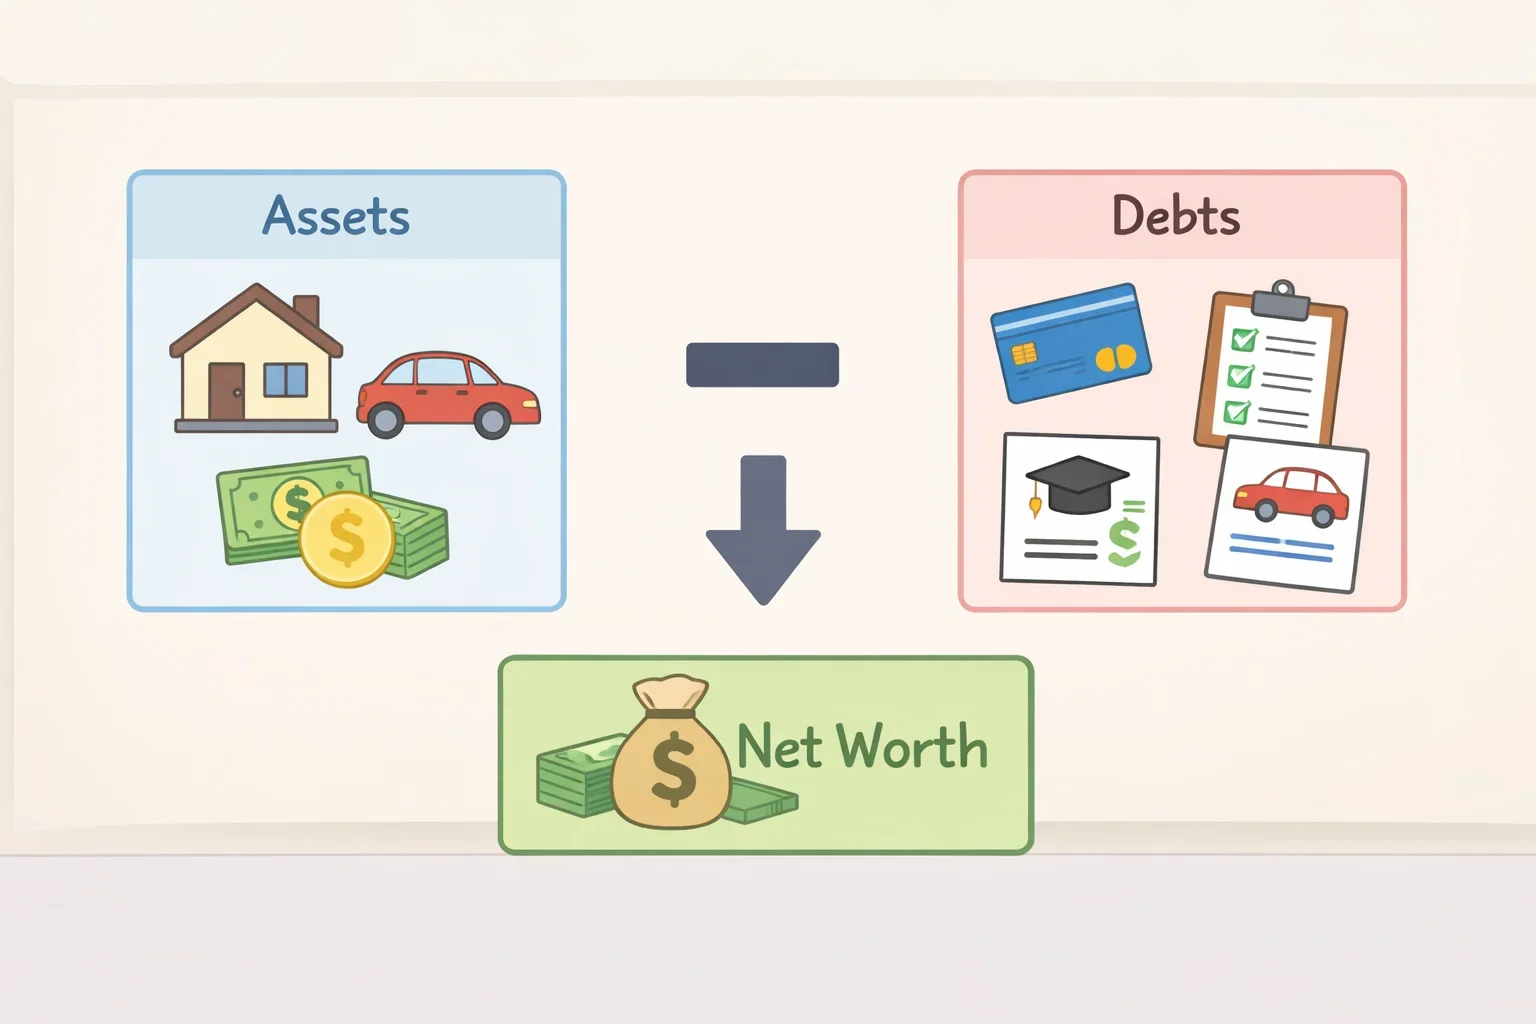
Net worth is simple on paper, and messy in life. The Census defines wealth as assets minus debts, which means a household can have negative wealth as well as positive wealth (U.S. Census Bureau, July 2025). The 10th percentile sat at $0, meaning 1 in 10 households had wealth of zero dollars or less (U.S. Census Bureau, July 2025).
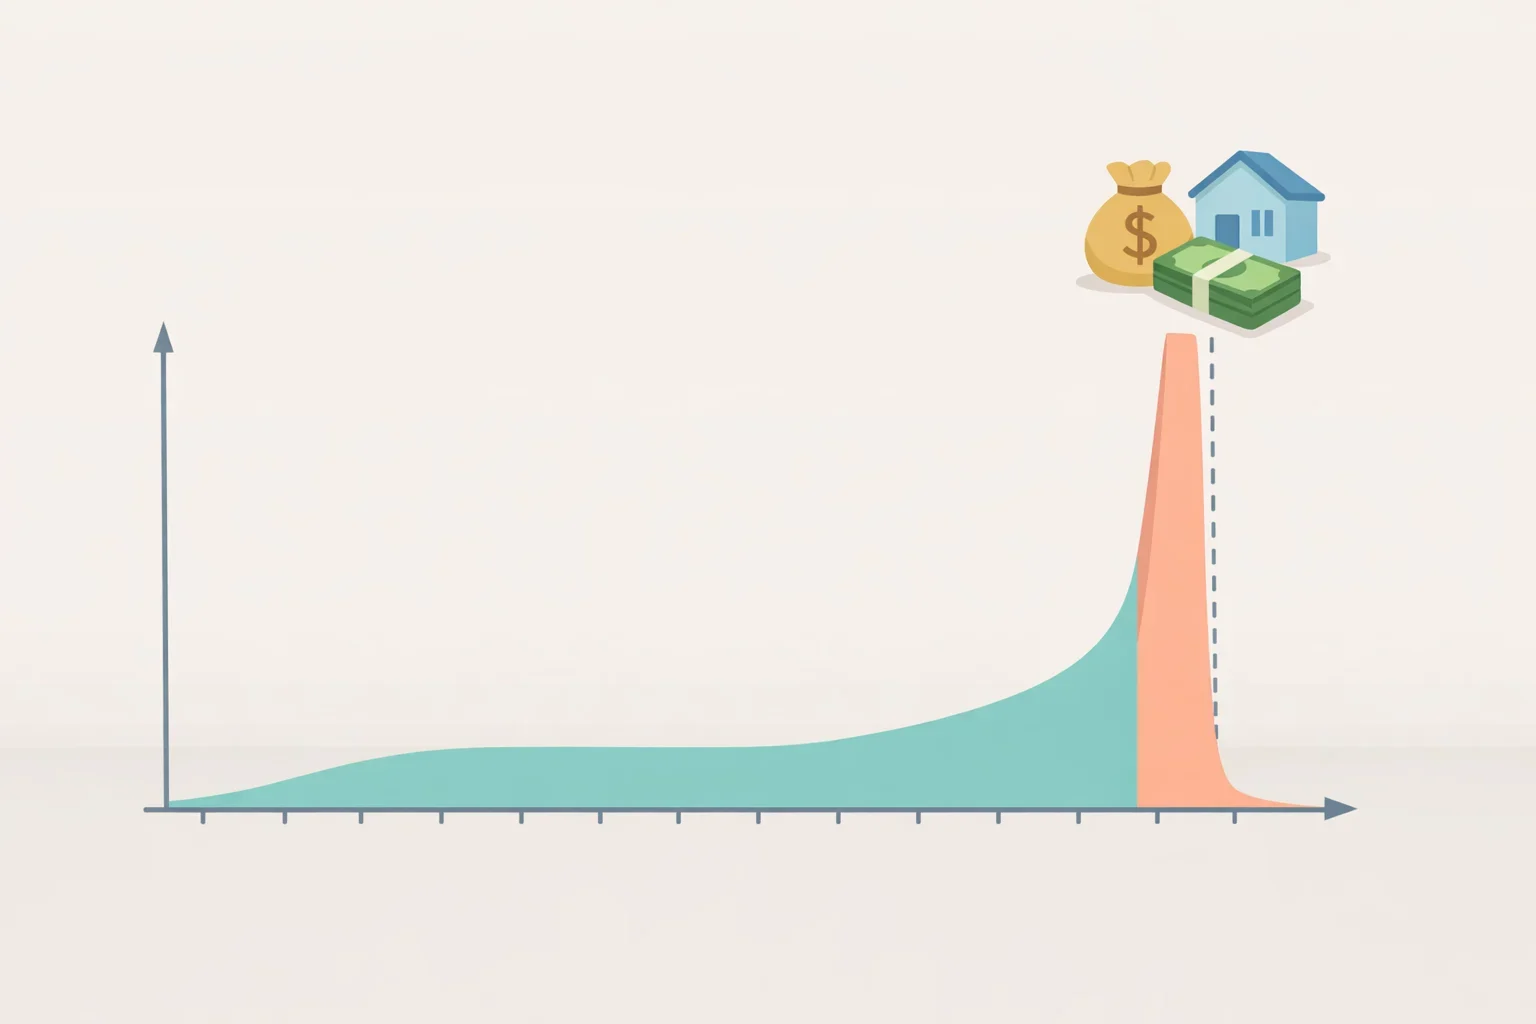
That matters because the threshold for the top 10% sits on a distribution with a long, thin tail at the bottom and a very steep climb at the top. The Census also treats households as the unit of analysis, so a married couple, a multigenerational family, or a single person all count as one household if they occupy a housing unit together (U.S. Census Bureau, July 2025). That makes the measure useful, but not personal in the way people often assume.
The Federal Reserve’s Survey of Consumer Finances points in the same direction. Between 2019 and 2022, real median net worth surged 37% to $192,900, while real mean net worth rose 23% to $1,063,700 (Federal Reserve, October 2023). The spread between median and mean is the giveaway. A relatively small number of very wealthy households pull the average up, while the middle barely moves in comparison.
So the answer to how much net worth puts you in the top 10% is not just a number. It is a reminder that wealth is distributed very unevenly, and that the distribution itself does the heavy lifting.
Where household wealth actually sits
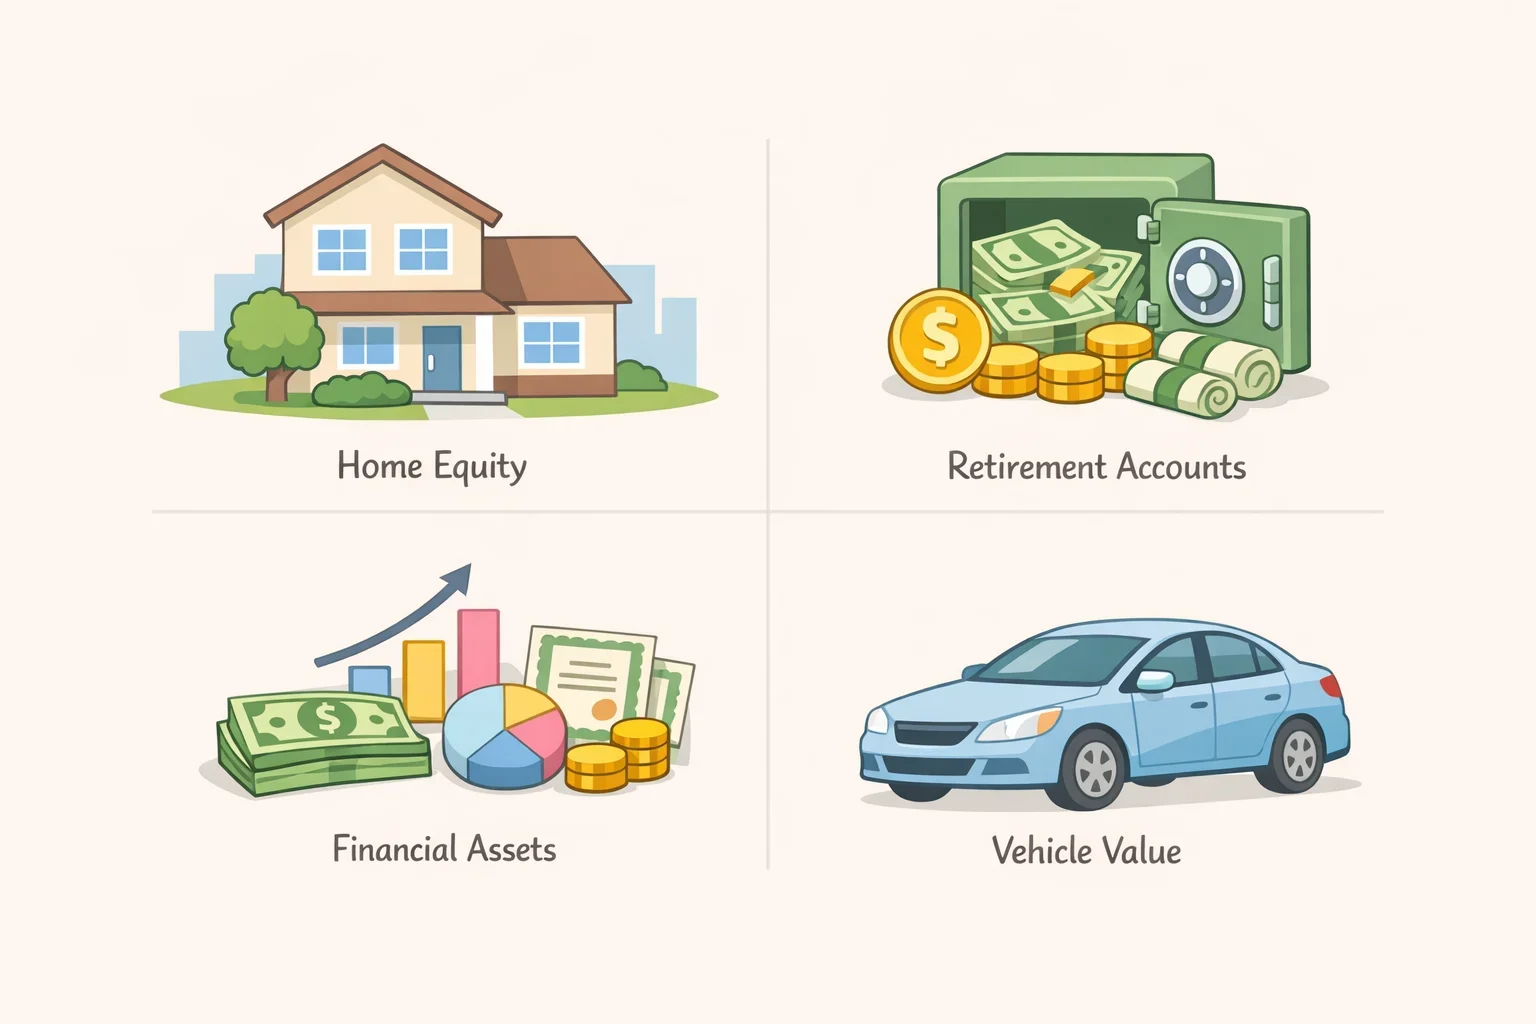
The assets that get households into the upper reaches of the distribution are not the ones people usually brag about over dinner. In 2023, home equity and retirement accounts made up 64.6% of aggregate household wealth. Home equity accounted for 30.9%, and retirement accounts made up 33.7% (U.S. Census Bureau, July 2025).
That leaves the more ordinary, liquid stuff looking small by comparison. Assets at financial institutions were owned by 96.0% of households, but their median value was only $10,080, and they represented 8.8% of aggregate wealth (U.S. Census Bureau, July 2025). Vehicles were also common, owned by 82.3% of households, yet their median value was just $13,220 and they accounted for 2.5% of aggregate wealth (U.S. Census Bureau, July 2025).
The biggest median asset values were tied to property. Rental property equity had a median value of $230,000, and primary home equity had a median value of $203,000 (U.S. Census Bureau, July 2025). But rental property was held by only 6.7% of households, while 62.3% owned a home during the year (U.S. Census Bureau, July 2025).
That is the pattern worth noticing. The road to the top 10% net worth threshold runs through property ownership, retirement savings, and time. It does not run through checking accounts, and it certainly does not run through a pile of old cars in the driveway. Much of that wealth is tied up in assets that are not easy to tap quickly, which helps explain why the headline number can look more liquid than it really is.
There is one more piece to the picture. In 2022, nearly half of families in the top decile of the usual income distribution owned a privately held business, compared with 20% of all families (Federal Reserve, October 2023). That does not mean business ownership is a requirement for entering the top 10%, but it does show how often private business equity sits behind the highest wealth levels. It is one of the few ways wealth can compound faster than patience alone would allow.
The gap above $1.8 million is wider than it looks
The top 10% threshold sounds like a finish line. It is really the doorway to a much larger room.
Arthur Kennickell’s analysis of the Survey of Consumer Finances shows that the 99.9th percentile of household wealth in 2022 was $62,125,130, adjusted to 2022 dollars (Stone Center, April 2024). That is not a typo problem. It is the point of the data. The scale at the very top rises with absurd speed.
Kennickell also shows that the two wealthiest groups, defined as households in the 90th through 100th percentiles, held between about 70% and 80% of all household wealth over the period from 1989 to 2022 (Stone Center, April 2024). At the other end, the least wealthy half of households held no more than 3.6% of total wealth at any point in that span (Stone Center, April 2024).
That is the real story behind the top-10% line. The cutoff is already very high, but it is also just an entry point into a distribution that gets dramatically steeper above it. A household with a little more than $1.8 million is in the same percentile band as a household with tens of millions, which is a useful reminder that percentiles are a blunt tool. They tell you where you sit, not how different the seats are.
Income and wealth make the point even more clearly when compared side by side. In 2022, the highest-income group received about 15% of total income, which Kennickell describes as roughly 15 times an equal share. The corresponding wealth group held about 35 times an equal share of total wealth (Stone Center, April 2024). High income helps. High wealth compounds.
What wealthy means once debt enters the picture
Any answer to what is considered wealthy in the U.S. needs a debt check. Wealth is not just about what sits on the asset side of the ledger. It is what remains after the bills are subtracted.
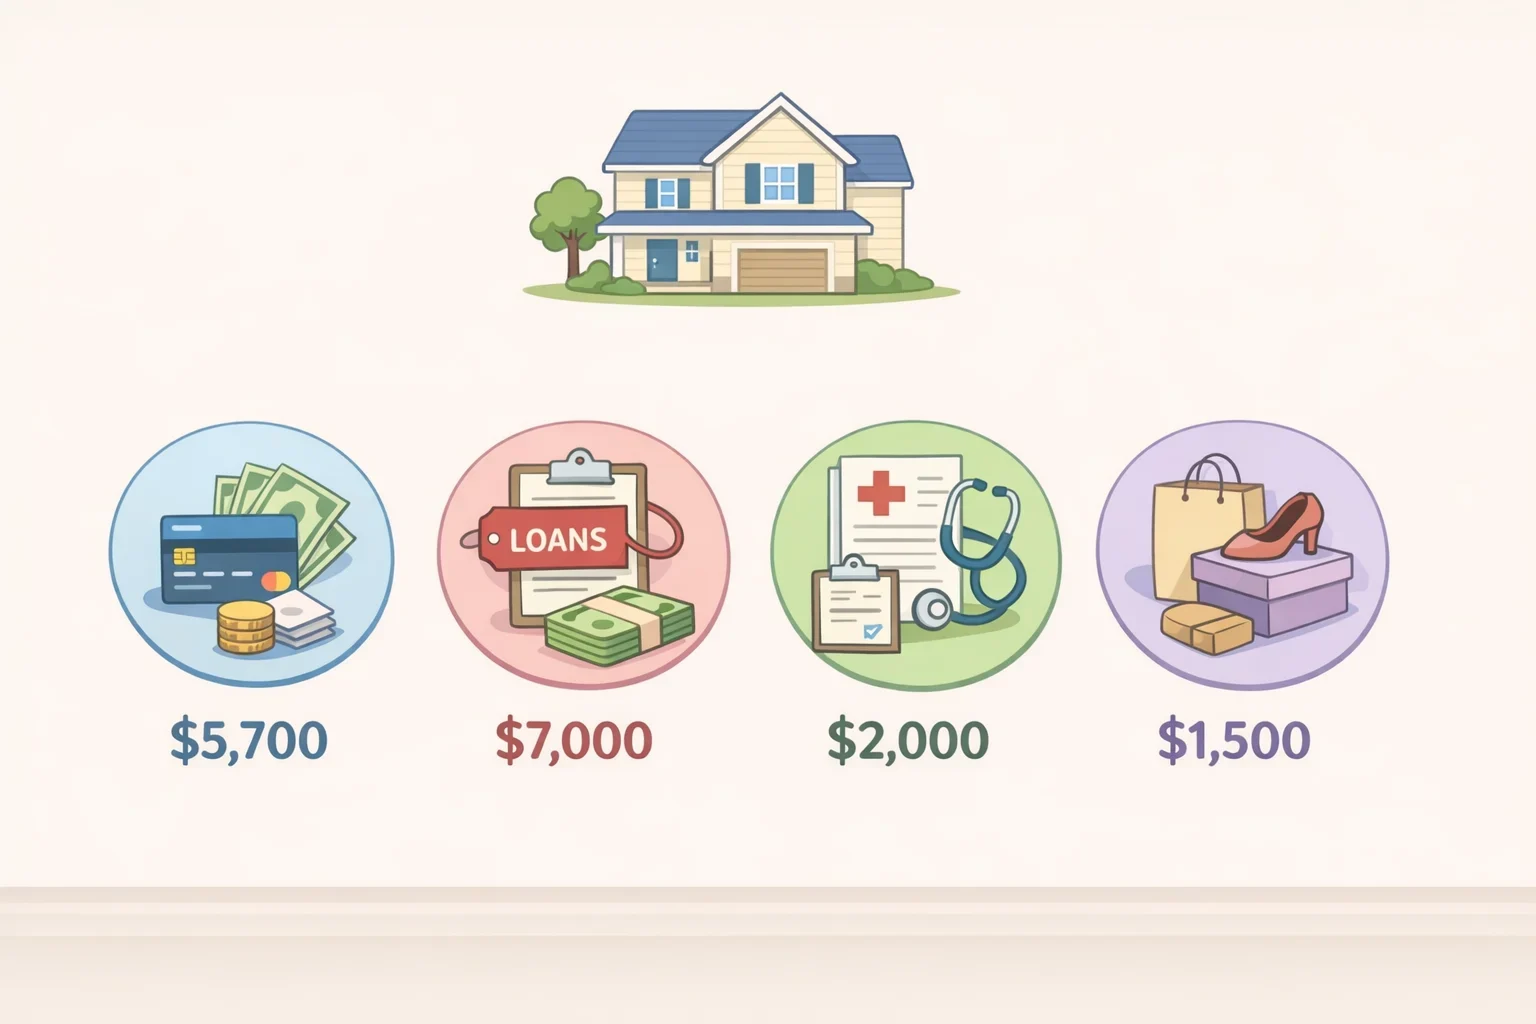
In 2023, 55.4% of households had some unsecured debt (U.S. Census Bureau, July 2025). Credit card debt was the most common, held by 42.0% of households with a median balance of $4,700 (U.S. Census Bureau, July 2025). Student loans were held by 18.9% of households and had the highest median balance at $25,000 (U.S. Census Bureau, July 2025). Medical debt affected about 16% of households, with a median amount owed of $2,000 (U.S. Census Bureau, July 2025).
Unsecured debt is not the same thing as mortgage debt. A mortgage can come with an appreciating asset attached. Credit cards do not. Student loans do not produce equity on their own. That distinction is why households can have decent incomes, even decent-looking assets, and still remain far from the top 10% net worth threshold.
The post-crisis picture also helps explain why wealth can feel more fragile than the headlines suggest. Before the Great Recession, roughly 7% to 8% of households had negative wealth. That share jumped after the recession and only returned to around that earlier level in 2022 (Stone Center, April 2024). The 2019 to 2022 gains in net worth were real, but they did not erase the deeper structure. They raised a lot of boats. They did not change the harbor.
The benchmark is real, but the context matters
A household wealth percentile is a useful marker, not a personal verdict. The Census threshold is a household figure, and it does not adjust for age, geography, or cost of living (U.S. Census Bureau, July 2025). A household with $1.8 million in home equity and retirement assets in rural Tennessee lives in a very different reality from one with the same net worth in San Francisco. Same number, different life.
That is why the top 10 percent household net worth figure works best as a benchmark. It shows that the line is much higher than popular shorthand suggests, and that it is built out of assets that are usually accumulated slowly and unevenly. It also shows why cash on hand is a poor proxy for wealth. The richest households are rarely the ones with the largest checking balances. They are the ones with appreciating assets, tax-advantaged savings, and enough time for compounding to do its quiet work.
The final takeaway is straightforward. If the question is how much net worth puts you in the top 10%, the answer is about $1.8 million (U.S. Census Bureau, July 2025). But the more interesting answer is what that number represents: not a finish line, but a position in a very steep hierarchy. Once you see that, “wealthy” stops sounding like a single status and starts looking like a structure.